Checking Top Indicators for Bitcoin
Let’s check the most important top indicators to determine whether we could enter another bear market.
Hey DEFI TIMES community,
The crypto markets have declined pretty heavily over the past weeks. We haven’t seen a significant recovery ever since. That’s why many people ask themselves whether we could enter another bear market.
What’s the best way to determine an oncoming bear market? Well, we have no reliable indicators for that.
Everything we have is so-called top/bottom indicators. These are on-chain metrics that have successfully predicted all previous Bitcoin cycle tops.
Of course, what worked in the past, doesn’t automatically have to work today! So we have to take each of them with a grain of salt; however, most of them have been surprisingly accurate in the past, which is why I regularly check them!
Now, let’s find out what those indicators tell us!
Let’s check the most important indicators for market tops to determine whether we could enter another bear market.
Subscribe to our newsletter to level up your crypto game!
Checking Top Indicators for Bitcoin
Net Unrealized Profit/Loss (NUPL)
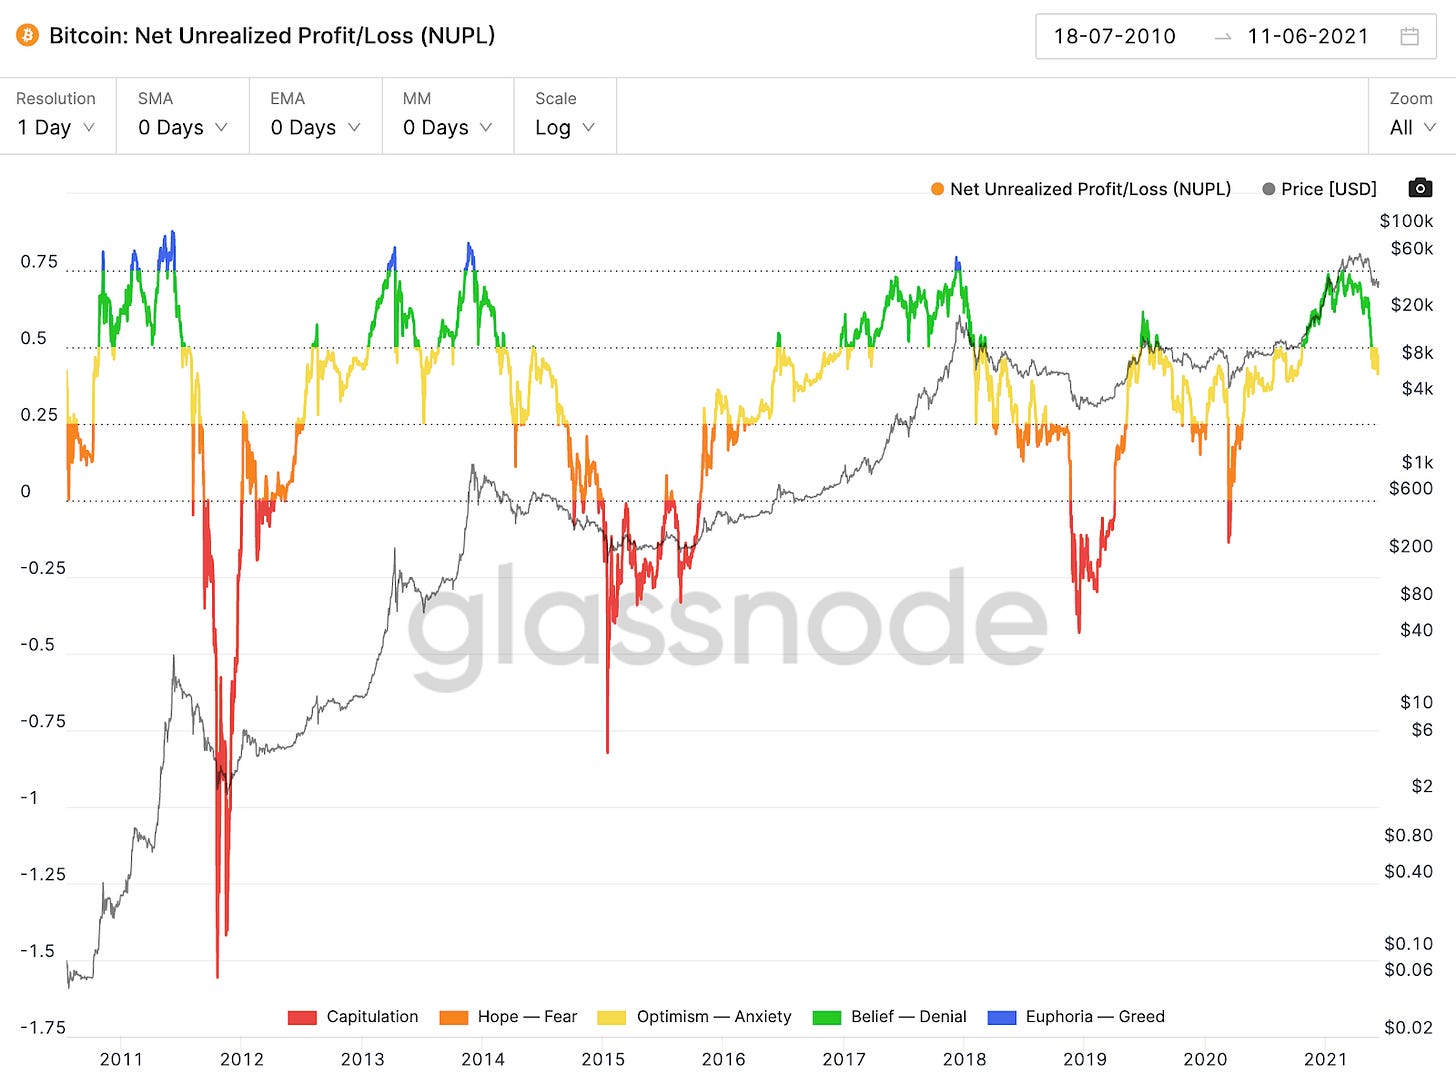
The NUPL is probably the most common top indicator for Bitcoin - it has literally predicted every single market top until today. In general, Net Unrealized Profit/Loss is the difference between Relative Unrealized Profit and Relative Unrealized Loss.

As you can see, at any given moment, the chart displays five different colors: red, orange, yellow, green, and blue.
Red = Capitulation
Orange = Fear
Yellow = Optimism
Green = Belief
Blue = Greed
Whenever we have reached the blue phase, Bitcoin has topped out - meaning that it was about to enter a bear market or a significant correction over several months. As you can see, the NUPL indicator called the top in 2011, 2013, and 2017.
However, according to the NUPL chart, we are yet to enter the euphoria phase. This means that NUPL suggests we have not seen a potential Bitcoin top yet.
In fact, we have only entered the Belief phase of the bull market. But with the recent drop, NUPL suggests that we are currently in the Optimism phase.
Reserve Risk
Another very popular top indicator is the Reserve Risk chart. It is used to assess the confidence of long-term Bitcoin holders relative to the price of the coin at any given point in time.

When confidence is high and the price is low, we get closer to the “green zone.” However, when long-term confidence is low and prices are high, we reach the “red zone.”
Luckily, we haven’t reached the red zone yet. Quite the opposite is true: we are getting closer and closer to the green zone - meaning that long-term Bitcoin holders are very confident about Bitcoin while prices are declining nonetheless.
Ultimately, the Reserve Risk chart suggests that we are far away from a potential market cycle top.
We are yet to reach the “red zone.”
Puell Multiple
The Puell Multiple was created by David Puell. It is calculated by dividing the daily issuance value of Bitcoin by the 365-day moving average of the daily issuance value.

When the Multiple crosses a Puell Multiple of 4, we could potentially see a market top.
In this case, the Puell Multiple would suggest that the daily BTC issuance is four times higher than its 365-day moving average.
The chart has been surprisingly accurate in 2013, 2014, and 2017. Let’s see if it works this time;
The Puell Ratio also suggests that we haven’t seen a market top yet.
Stock to Flow Deflection
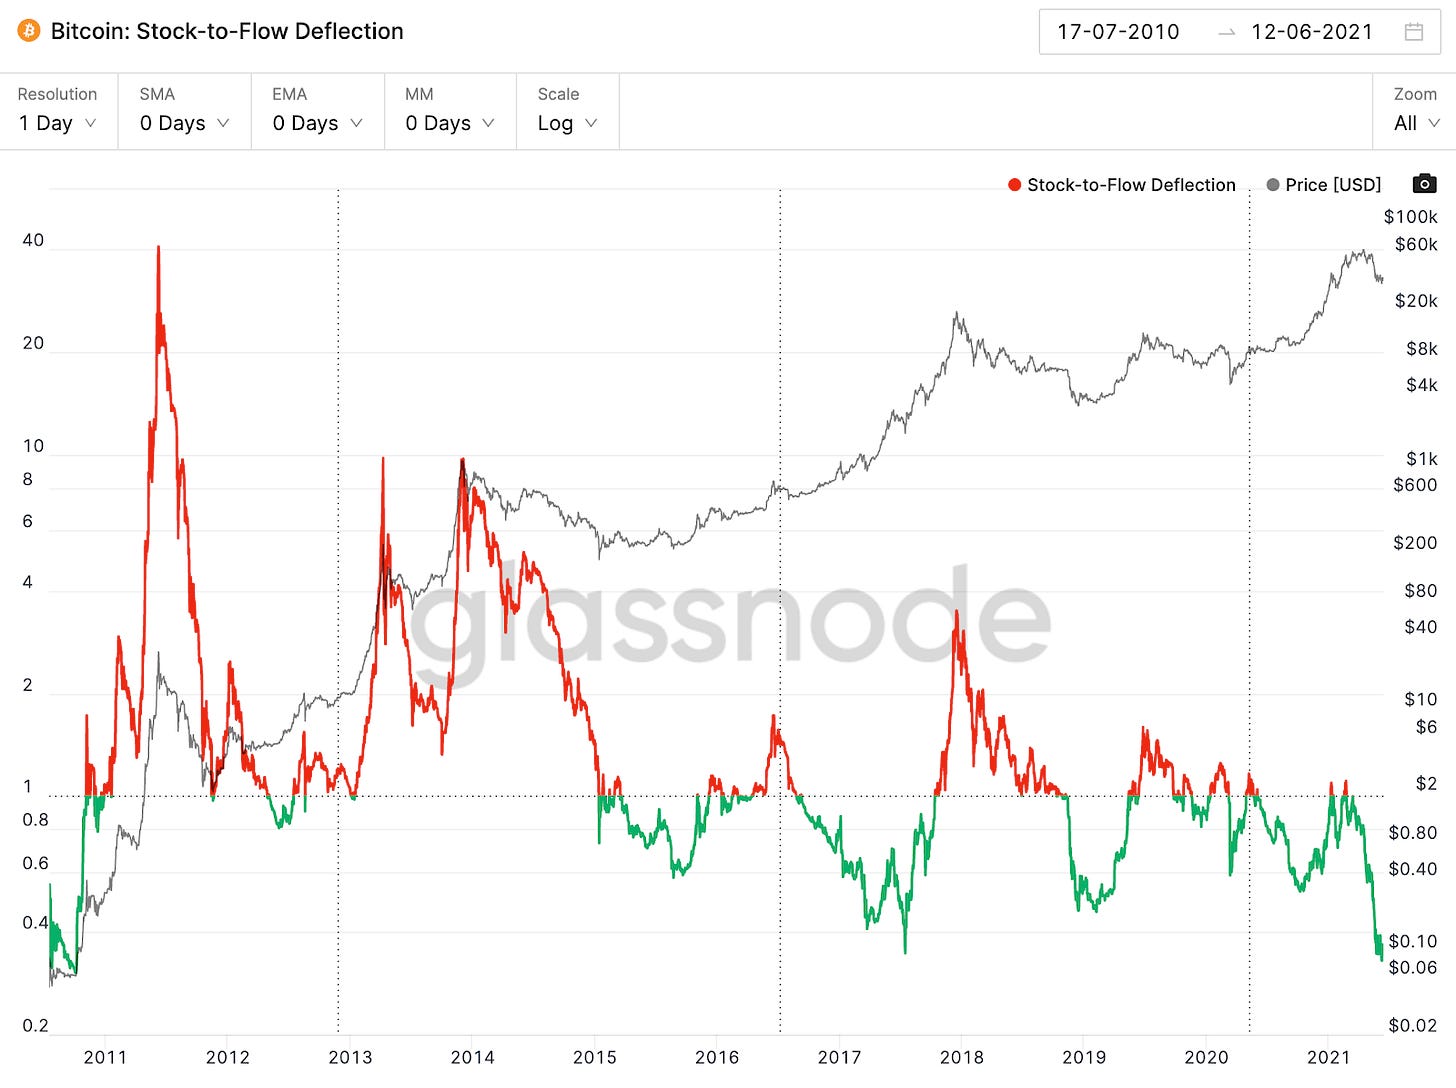
The Stock to Flow Deflection is the ratio between the current Bitcoin price and the Stock to Flow Model. The Stock to Flow model is probably the most famous model to predict the Bitcoin price. It builds on the so-called “Four-year cycle theory,” which says that each Bitcoin cycle is driven by its halvings. It was created by PlanB, assuming that scarcity drives value.

Also the Stock to Flow Defection chart suggests that we haven’t seen a potential Bitcoin top yet. In fact, the Stock to Flow model indicates that Bitcoin trades way below its true price.

Conclusion
All major on-chain top indicators show the same picture: We probably haven’t seen Bitcoin’s peak yet.
Please note that these are only on-chain metrics, which leave out important information like macroeconomics, global sentiment, innovation, and so on.
However, these indicators have turned out to be a good way to lead us through the bull market!
Let’s see if they work again this time!
Find us on:
DISCLAIMER: All information presented above is meant for informational purposes only and should not be treated as financial, legal, or tax advice. This article's content solely reflects the opinion of the writer, who is not a financial advisor.
Do your own research before you purchase cryptocurrencies. Any cryptocurrency can go down in value. Holding cryptocurrencies is risky.


